|
Legacy Conversions: Many projects involve converting a legacy application (e.g., COBOL, Natural) to a more modern language (e.g., Java). There are two approaches to conversion, migration or modernization. Migration results in a new system that has exactly the same functionality as the existing system, and to the extent possible, works the same way. Modernization results in a new system with equivalent business functionality but modified to take advantage of improvements in design, approach, user interaction, and so on. To estimate these projects, begin by quantifying the size of the existing system, often by counting the source lines of code. For modernization projects, apply the COCOMO II reuse model where you set code change and I&T to 100%, and use appropriate values for DM, AA, SU, and UNFM. For Migration, determine the % of code conversion you expect to achieve, then apply the COCOMO II factors separately to the manual and automatically converted code. New functionality is estimated separately and added to the estimate.
|
|
 |
|
|
ExcelerPlan is now available to government customers under our GSA Schedule 70. For details and GSA pricing, email edward@portal.level4ventures.com.
Level 4 was awarded an estimation related contract with Accenture.
|
|
|
|
All times are Pacific Time!
Free WebEx
Estimating with ExcelerPlan
1/14, 11 AM-12:30 PST
1/22, 11 AM-12:30 PST
2/5, 11 AM-12:30 PST
2/19, 11 AM-12:30 PST
3/5, 11 AM-12:30 PST
To register for demos, email:
Edward@portal.level4ventures.com
|
|
|
|
Live Training in Sacramento
We’re coordinating with a few state agencies to offer a 1.5 day live cost estimating training class at a location up in Sacramento sometime during March. The cost for the class will be $495, which can be applied toward any ExcelerPlan license purchase within 90 days.
To inquire about registration email:
Edward@portal.level4ventures.com
|
|
|
|
Maintaining your Karma
I hope that you’ve been enjoying the high quality of the content in these newsletters, and appreciating the fact that they are only intruding into your mailbox once per month. If you’ve been getting value from them, then that’s a form of Karma deficit. So how do you balance things out? Well, of course you could purchase a license to ExcelerPlan. But maybe you’re not ready for that yet. In that case, the easiest way to balance the Karma equation is to forward this newsletter to three of your friends that might benefit from the information.
Edward
Director of Sales and Marketing
|
|
|
|
Discounted Live Training in Sacramento
|
|
|
Sign up for a 1.5 hour live class, taught by William Roetzheim, to be conducted in Sacramento sometime in March at the discounted rate of $495 with the full class fee available as a credit toward an ExcelerPlan license purchased within 90 days of the class.
|
|
|
|
|
|
|
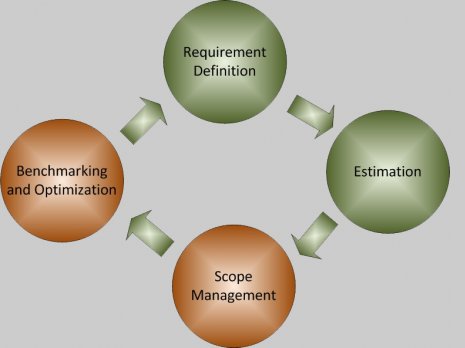
 Areas of Optimization: Areas of Optimization: Last month we discussed the foundational corporate capabilities that should be in place before attempting information technology optimization. These were a will to optimize supported by benchmarking to identify targets for optimization; which requires scope management to have a stable and known quantity of delivered functionality; which requires estimation to ensure that the scope is correctly defined and adequate resources and time are available to deliver; which requires requirements that are tied to delivered business functionality. With this in place, you have all of the elements in place to begin optimization by benchmarking against internal and external benchmarks. Recall that external benchmarking is a comparison against industry norms or best practices; while internal benchmarking is a comparison with yourself over time, or comparison between groups within the same company. So, what are some examples of useful optimization initiatives? Time: For some organizations, IT value is maximized by improving turn-around time for product development, enhancement, and deployment. Deployment time is normally roughly proportional to the cube root of the project size in Function Point equivalents, so you can’t simply use a metric like implementation time per project Function Point Equivalent (FPE). But if you wanted to do internal benchmarking over time, you would get decent results by defining a goal in terms of implementation time per FPE**.3, or in Excel form, per Power(FPE,.3). For typical organizations, a 15% improvement is practical with work.
Productivity: Productivity is simply the project labor hours per unit of production, or FPE. You can measure productivity at the project level, at the role level (e.g., testers), or at the department/region level. For most organizations, a 30% improvement is practical with work.
Cost per Unit (CPU): Cost per FPE. This metric is different than productivity because it factors in labor rates. Again, you can measure CPU at the project, role, or department/region level.
Defects per Unit (DPKU) and Weighted Defects per Unit (WDPKU): Defects per thousand units of production (thousand FPE, or KFPE); and weighted defects per KFPE. The only difference is that the weighted measure takes defect severity into consideration.
|
 |
|
Next month we’ll discuss 2 ways to overcome organizational resistance when deploying estimation support.
William@portal.level4ventures.com
|
|
|
|
|
|
|
|
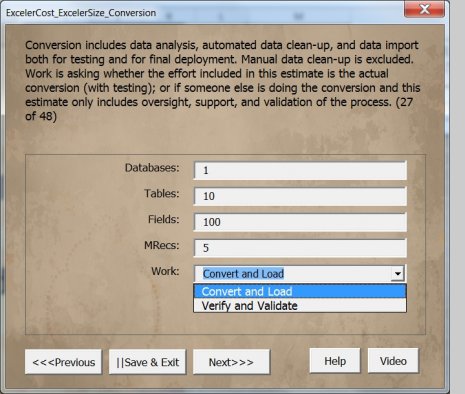
ExcelerCost in More Depth: Version 7.0 of ExcelerPlan shipped on schedule, featuring the new ExcelerCost wizard. As we discussed last month, the wizard begins by interviewing you about your project, thereby selecting the specific areas that need to be estimated. This month we’ll discuss how it handles those specific areas, using data conversion to illustrate the process.
The ExcelerCost wizard knows that data conversion equivalent size is driven by the number of databases, tables, fields, and million customer master records (MRECs) to be converted. So it prompts you for those values. If you’re not sure about the meaning of any of the fields, you can select Help for some context sensitive help, or Video to see a short video clip of yours truly explaining this sizing area in more depth. In addition to the equivalent size of the effort required, we need to know the specific work to be performed. In this case ExcelerCost is asks if you want to estimate the work to do the full conversion, or just the work to oversee and validate the conversion by others.
Next month we’ll start a series covering the ExcelerSize high level object set in some depth.
|
|
|
|
|
[This guest column reprinted with permission from: “MINIMIZING THE RISK OF LITIGATION: PROBLEMS NOTED IN BREACH OF CONTRACT LITIGATION,” Capers Jones, July 2014. Full article available on http://Namcookanalytics.com]
[Editor: This column continues the discussion of litigation risk factors from last month’s edition.]
Problem 1: Estimating Errors and Estimate Rejection
Although cost estimating is difficult there are a number of commercial software cost estimating tools that do a capable job: COCOMO II, ExcelerPlan, KnowledgePlan, True Price, SEER, SLIM, and Software Risk Master ™ (SRM) are examples available in the United States.
However just because an accurate estimate can be produced using a commercial estimating tool that does not mean that clients or executives will accept it. In fact from information presented during litigation, about half of the cases did not produce accurate estimates at all and did not use estimating tools. Manual estimates tend towards optimism or predicting shorter schedules and lower costs than actually occur.
Based on 50 samples of each, manual estimates and parametric estimates produced similar results below 250 function points. However as sizes increased manual the estimates became progressively optimistic and understated both costs and schedules by more than 25% above 5,000 function points.
Early estimates using parametric estimation tools combined with early risk analyses are a solid first-line defense against later litigation. The author’s Namcook estimation tool Software Risk Master ™ (SRM) includes patented features for early estimation prior to requirements and also includes an integral risk analysis feature. It predicts both the odds and costs of breach of contract litigation as well.
Next month: Missing Defensible Objective Benchmarks
Capers
|
|
|
|
 Dear Tabby: My girlfriend can never make up her mind. Everything about our dates is uncertain. I keep telling her that all of this uncertainty increases the cost of our dates, but it’s still impossible to get her to commit to specifics. I’m forced to take my budgets for each date and double it because of uncertainty. How can I prove to her that there is a huge cost to this uncertainty?
signed, Doubling i Dallas
Dear Doubling in Dallas:
It is a common misconception that the way to overcome uncertainty is to increase estimates to compensate. But if you view uncertainty as the width of the bell curve for a statistical forecast, changing that width does not move the midpoint (peak). And a proper estimate is always the midpoint, which corresponds to the mean. What will vary based on uncertainty is the estimate range. So a clear definition of expectations might result in a budget of $100 plus or minus $5; while a vague definition of those same expectations would result in a budget of $100 plus or minus $50. So the lower the tolerance for variation on individual projects, the tighter the specifications need to be. In your case, it sounds like you have a low tolerance while your girlfriend has a high tolerance. By doubling your estimates, what you’re doing is increasing the probability that the project will come in at or under budget; but at the expense of efficiency.
signed, Tabby
|
|
|
|
 |
|
Enhanced Environment Insight: ExcelerPlan version 7.0 displays additional information about the environmental selections. Previously these values were set in the background, but not fully exposed to view. The variables are:
M(A): This is the linear productivity factor multiplied times the function point equivalent (FPE) to determine the total person hours of effort required. So a 7% change would correspond to a 7% increase in calculated effort for the same size project.
M(B): This is the non-linear productivity factor used when adjusting the project size (in FPE) to account for economies and dis-economies of scale. Numbers greater than 0 mean that larger projects are less efficient than smaller projects, and the inverse is true for numbers less than 0.
Size: This represents a linear multiple project size itself (in FPE). It differs from M(A) in the M(A) adjustments affect effort but not size, while Size adjustments affect both size (directly) and effort (indirectly).
|
|
|
|
|
|
|