 Consider EaaS: Your IT estimation process now is probably highly distributed. How many people attend estimation related meetings? How many people need to read the requirement specifications as part of coming up with estimates? Are these people your entry level people–or your more senior, experienced staff? If you’re like most organizations, you’re spending between 2% and 4% of your IT budget on estimation related activities…whether you know it or not. Is there an alternative? Just ask the construction industry. They figured out a long time ago that distributed estimating by the hands-on folks is both inefficient and not very accurate. Consider EaaS: Your IT estimation process now is probably highly distributed. How many people attend estimation related meetings? How many people need to read the requirement specifications as part of coming up with estimates? Are these people your entry level people–or your more senior, experienced staff? If you’re like most organizations, you’re spending between 2% and 4% of your IT budget on estimation related activities…whether you know it or not. Is there an alternative? Just ask the construction industry. They figured out a long time ago that distributed estimating by the hands-on folks is both inefficient and not very accurate.
While not always a viable solution, if your organization can move to an Estimation as a Service (EaaS) model, you’ll have some impressive advantages. With EaaS you have a small number of estimators that do all of the estimation related activities. They develop estimation related skills and become highly efficient and effective at this activity, typically cutting overall estimation costs by 50%. A question I get a lot is, “What would I look for when hiring someone for this role?” The best IT estimators either come from a solid business background with an interest in learning a bit about the technical side of things; or come from a technical architecture background with an interest in learning more about the business side. |
|
 |
|
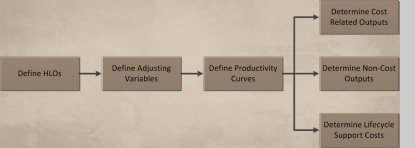
Core Estimating Concepts: While there are lots of IT estimation models out there, most of them do have some core estimation concepts in common, and understanding those core concepts will help you understand pretty much every cost model. Each model uses some type of sizing input to quantify the magnitude of work to be performed. These High Level sizing Objects (HLOs) might be source lines of code (SLOC), function points, use-case points, Agile story points, or any of several dozen other common models. The counted size is then adjusted based on project specific adjusting variables, for example the IFPUG value adjusting factor or the COCOMO II environmental adjustments. A curve is then used to convert the adjusted size into effort, where the shape of the curve tells you if there are economies or dis-economies of scale at work. The output results are total project effort and duration. Allocation templates can then be used to calculate a wide range of useful outputs, including cost related outputs such as cost by phase and cost by role; non-cost outputs such as forecast number of test cases and number of defects; and lifecycle support costs such as maintenance and operations. I’ll discuss all of these models in future articles. |
|
|
|
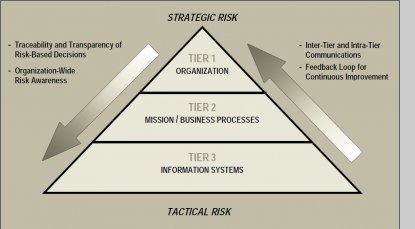
Start with Risk Boundaries: Organizations are subject to a wide range of risk, including actuarial risk (think life insurance), investment risk (think pension funds), and organizational risk. Information Technology (IT) related risk is normally classified as an organizational risk, but all too often all IT risk is lumped together into one risk category. Unfortunately, this doesn’t work very well because there is no one framework for risk management that properly handles all of the types of information technology risk. A good starting point is the NIST 800-30 three tier model, where Tier 1 risks are organizational level risks; Tier 2 risks are risks to individual missions or business processes; and Tier 3 risks are risks to specific information systems. But the NIST 800 three tier model does not have enough granularity to fully meet the needs of IT risk classification. In addition to the three identified tiers we must break out projects as a separate category of risk; and we would often break out databases and reference architectures as separate areas for analysis. (Reference Architectures are related architectural components deployed in multiple systems, as for example .Net 3.0). So when discussing risk assessment and control, one of the first things you should do is to make sure that all of the stakeholders are talking about the same types of risks operating on the same organizational components. |
|
|
|
 Dear Tabby: Dear Tabby:
My CTO tells me that we can use the budget to forecast how many Agile stories we can build, but I say we should use the number of Agile stories to forecast the budget. So which came first, the stories or the budget?
signed, Chicken…No, Egg…No Chicken
Dear Chicken:
You and your CTO are both right. Agile stories are both a sizing metric and a development artifact, so they can be an input or an output (or both!). But this is not unique to Agile, several other sizing metrics have the same property (e.g., UML Class-Method Points). For Agile development you’ll normally start with a higher aggregate sizing method (e.g., features, epics, products) and forecast stories at the start to help with your backlog development, then use stories and velocity to update the estimates for each sprint.
|
|
|
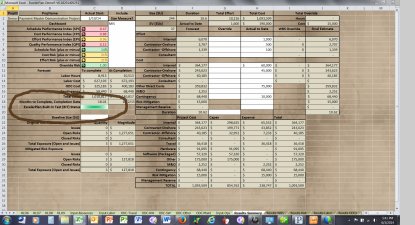
Built-In Test: If you’ve looked closely at the ExcelerPlan Results-Summary worksheet, you might have noticed a green cell labeled “Built-In Test” and wondered what that was all about. While the objective of software development is to write code that is bug free, a closely related objective is to make sure that defects in the software are not lurking in the background doing damage without any visible indication of problems. ExcelerTools software integrates hundreds of models and thousands of formulas (more than 10K formulas at last count). But how do you really know that the calculations are correct? An approach often used by hardware engineers is to integrate a built-in test capability into each board. Maybe it’s our embedded development background coming out, but we’ve done something similar with ExcelerTools. We’ve identified more than 250 critical touch-points in the back-end calculation engine. At each one of these touch-points we can perform some type of validity check (e.g., checksum, multiple calculation comparison, etc.), and if the number ever differs by more than one-cent from the expected value we raise a bit error and set this indicator from green to red. Even better, if you provide a copy of the spreadsheet with the BIT error to us our engineers can run a diagnostic program that tells us exactly where the calculation failed, so we can normally fix the defect in a matter of hours. |
|
|
|
|