| Budgeting for Change: Change is inevitable, and the longer your project the more you’ll need to cope with (and budget for) change during the life of the project itself. This is best accomplished using 4 line items. Requirement change ranges from 3% to 15% per year (Capers quotes 1% per month), with 7% typical for government projects. Contingency normally ranges from 5% to 20%, with 10% to 15% being the most common for government projects. Longer projects will require maintenance during the project itself, so maintenance models for corrective, adaptive, and perfective work should be used for part of the project duration. And finally, a management reserve may be appropriate if the project represents high operational risk. |
|
|
Level 4 was awarded a five year estimation contract with the Department of Justice, and an information technology governance process support contract with the GSA One Acquisition for System Integration Services (OASIS) project.
We’re pleased to announce a cooperative relationship between L4V and MB-Level 4 AG. MB-Level 4 will be providing European clients with cost estimation process and consulting support using ExcelerPlan. They will also offer support during the configuration and calibration phase of ExcelerPlan enterprise deployments to European clients. |
|
|
All times are Pacific Time!
Free WebEx
Estimating with ExcelerPlan
10/9, 11 AM-12:30 PDT
10/16, 11 AM-12:30 PDT
11/6, 11 AM-12:30 PDT
11/20, 11 AM-12:30 PDT
To register for demos, email:
Edward@portal.level4ventures.com |
|
|
Free ExcelerPlan License with Training Purchase
Extended through October 31st: Sign up for our 12 module self-paced video training program for $1,995 and receive one free license to ExcelerPlan with six-months of maintenance, support, and license activation. You’ll also receive 24 Professional Development Units (PDU) of training credits (Certificate requires verification of attendance plus passing final exam.)
To register for training and your free six-month license, email:
Edward@portal.level4ventures.com |
|
|
I was talking to a potential ExcelerPlan customer, and he was skeptical that any tool could accurately estimate their information technology projects. He asked me what Level 4 does if the models can’t be made to work. I thought that was an interesting question, so I passed the question on to Mr. Roetzheim. Here’s his response:
“If the new estimation process and models don’t work because people won’t use them, then there’s nothing we can do. But if they don’t accurately estimate, and we can’t fix that, then we wouldn’t accept payment. That’s never happened, but I would never take money for something that doesn’t work.”
There you have it!
Edward
Director of Sales and Marketing
|
|
|
| Free ExcelerPlan with Training Purchase |
|
| Extended through 31 October: You can obtain a free ExcelerPlan license with the purchase of our self-paced estimation training. See column above for details. |
|
|
|
|
|
|
 Benchmarking Denominators: All benchmarking involves ratio analysis, where the metric of interest is in the numerator and an adjusting metric is in the denominator. For example: Productivity measures hours per unit of production; Efficiency measures cost per unit of production; Quality measures defects per unit of production. The denominator is “unit of production.” Measuring this is relatively easy if you are manufacturing light bulbs. But it’s much more difficult when you are developing, or perhaps just configuring and installing, software. We need a way to measure a unit of production for all of the types of information technology projects you perform during the year. Benchmarking Denominators: All benchmarking involves ratio analysis, where the metric of interest is in the numerator and an adjusting metric is in the denominator. For example: Productivity measures hours per unit of production; Efficiency measures cost per unit of production; Quality measures defects per unit of production. The denominator is “unit of production.” Measuring this is relatively easy if you are manufacturing light bulbs. But it’s much more difficult when you are developing, or perhaps just configuring and installing, software. We need a way to measure a unit of production for all of the types of information technology projects you perform during the year.
The earliest attempt at measurement focused on source lines-of-code, or SLOC. This was better than nothing, especially in the coding intensive early days of software. But SLOC has many major disadvantages that outweigh their advantages for most IT projects. These include measurement ambiguity (e.g., physical versus logical lines, language adjustments); efficiency ambiguity (studies show that different programmers, given the exact same relatively simple programming requirements, will generate code that varies by 10 fold in terms of SLOC count); implementation ambiguity (e.g., machine generated code); and a focus on only one aspect of implementation (coding). My general recommendation is to use SLOC as a backup analysis methodology for legacy system sizing, and for relatively small embedded projects. But for most information technology projects, there are better measures available than SLOC. (For a more detailed look at the problems of SLOC, see “Hazards of “lines of code” metrics,” by Capers Jones.)
Next month I’ll go over some benchmarking denominators that do work.
william@portal.level4ventures.com
|
|
 |
|
|
|
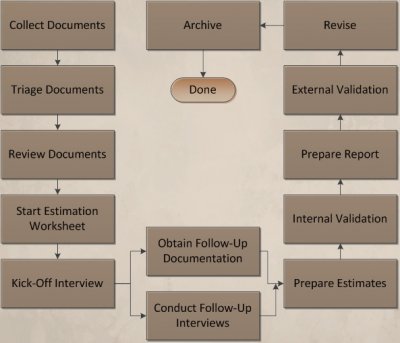
Estimation Process (part 4), The Estimation Report: The estimation report is where you document the results of your estimation work. Reports will vary significantly in formality, from simple result summaries all the way to thorough documentation that will withstand significant external scrutiny. The key is to understand the audience of the report and to ensure that the level of detail meets the need of that audience. But let’s start with the elements that should be present in all estimation reports. These are: the name of the estimator(s); the purpose of the estimate; the boundaries of the estimate (inclusions and exclusions); the basis of your estimate (e.g. size and assumptions); and the results. If the estimation report will be used more formally, you might need to include comparative validating estimates (e.g., multiple estimates performed using different approaches); quantification of confidence level (risk and uncertainty); and evidence of qualifications for the estimator/tool/models. If the estimation report will be used to support project management, you’ll need to include more detailed allocations of effort/time/cost by phase, role, and so on.
Next month I’ll talk about external validation and archival.
|
|
|
|
|
[This guest column reprinted with permission from: “RETURN ON INVESTMENT (ROI) IN SOFTWARE PROJECT MANAGEMENT TOOLS AND SOFTWARE QUALITY CONTROL,” Capers Jones, July 2014. Full article available on http://Namcookanalytics.com]
The standard economic definition of productivity is “good or services produced per unit of labor or expense.” Software bugs or defects are not “goods or services” but rather unfortunate accidents. The metric “cost per defect” does not measure economic value, and also has a fatal flaw. The “cost per defect” metric is always cheapest where the largest number of defects are found. Therefore this metric penalizes quality. It cannot safely be used to show the real economic value of quality. To measure the economic value of quality, it is necessary to show the overall costs of the entire application with and without excellence in terms of quality control (and project management.) You also need to know the costs of project management and quality tools and methods.
Let us make some simplifying assumptions. Assume that the average cost to build a successful software application in the 10,000 function point size range is about $1000 per function point or $10,000,000. However, unsuccessful projects that are cancelled usually accrue costs of more than $1,500 per function point and are about 12 months late when they are cancelled. In other words, cancelled software projects in the 10,000 function point range cost about $15,000,000 and obviously are a write-off without any positive value.
- The costs of fully equipping software project managers on 10,000 function point projects with state of the art software cost and quality estimating tools is not very expensive: the cost would normally be less than $10.00 per function point or only about $100,000. The total cost per manager would only be in the range of $10,000 or less.
- The costs of performing formal design and code inspections run to about $100 per function point, or roughly $1,000,000 for a 10,000 function point application.
Thus an investment in state of the art project management tools and quality control nets out to about $110 per function point. But this investment could raise the probability of a successful outcome from less than 25% to more than 75%. Thus an investment of about $110 per function point could head off a possible loss or write-off of $1,500 per function point. This would generate an approximate return on investment of $13.64 for every dollar spent which is quite a good ROI.
Further, applications in the 10,000 function point size range have shorter schedules and lower costs if effective project management and quality control are part of the development process. Even with $110 per function point for inspections and management tools, the probable development cost of this hypothetical application might drop to only $850 per function point or $850,000 in total.
Capers Jones
|
|
|
|
 Dear Tabby: Dear Tabby:
I have a boyfriend in India that works 190 hours per month and tells me I’m lazy. I’m in the USA and I work 142 hours per month, but I think I’m more productive per hour than my Indian boyfriend. he thinks I’m nuts. What do you think?
signed, Programmer in Piedmont
Dear Programmer:
Well, I hate to go against the common wisdom in every country which says that “we” are more productive than “they”, but there is no statistically significant correlation between the country where the work is performed and productivity when measured in terms of effort per unit of production. The statistics in this area can be confusing because of the differences in work hours per year and the inefficiencies inherent in multi-site versus fully co-located work; but geographic location itself is not a predictor of productivity.
signed, Tabby
|
|
|
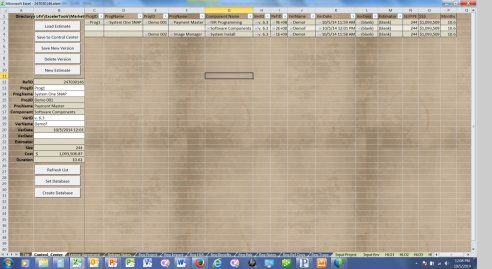 |
Control Center: Version 6.3 of ExcelerPlan introduced the integrated Control Center. Until now, ExcelerPlan users had two choices when archiving their completed estimates. The files could be stored to a hard drive (locally or shared); or the files could be stored in a document version control system (e.g., SharePoint). Those options are still available, but the ExcelerPlan Control Center allows you to use a shared directory to store your finished ExcelerPlan estimates with support for aggregation by program, project, component, and version. In addition, Control Center supports version management so that your entire team can use one corporate repository for all of your estimates.
|
|
|
|
|
|